Your cart is currently empty!

3WART Content Performance Heatmap Pro
45,00 ₾
≈ 15,60 $ (USD)
The 3WART Content Performance Heatmap Pro plugin is an essential WordPress tool designed to revolutionize how website owners, marketers, developers, and UX professionals understand user interaction. By providing deep, actionable insights into how visitors engage with your content – visualizing clicks, mouse movements, and scrolling behavior – this plugin empowers you to significantly enhance website usability, engagement, and conversion rates.
Description
The 3WART Content Performance Heatmap Pro plugin is a powerful WordPress tool designed to help website owners, marketers, developers, and UX professionals understand exactly how users interact with their content. By visualizing user clicks, mouse movements, scrolling behavior, and other interaction patterns, this plugin provides actionable insights to improve website usability, engagement, and conversions. It works seamlessly with standard WordPress posts, pages, and WooCommerce product pages, making it ideal for blogs, business websites, e-commerce stores, and landing pages.
Key Features & Functionalities
1. Interactive Heatmaps
- Visualize clicks, mouse movements, and scrolling behavior directly on your website.
- Fully responsive and dynamically generated using HTML5 Canvas.
- Supports dark mode for better readability.
- Overlay multiple datasets in comparison mode to detect differences between user groups, devices, or time periods.
- Automatically scales heatmaps to full-page dimensions, including long-scroll pages.
2. Behavioral Analytics
- Rage Clicks: Detect areas where users repeatedly click in frustration.
- Dead Clicks: Identify clicks on non-interactive elements like text or page background.
- Hover Interest: Highlight zones where users hover without clicking, showing areas of passive engagement.
- Metrics are displayed in an easy-to-read table with detailed explanations.
3. Engagement Metrics
- Total Clicks & Mouse Movements: Track overall interaction levels.
- Average Scroll Depth: See how far users scroll down a page.
- Scroll Depth Percentiles: Analyze the 25%, 50%, and 75% scroll depth for users.
- Weighted Attention Score: Summarizes user activity in a single metric.
- Device Breakdown: Understand how desktop, tablet, and mobile users interact differently.
4. Comparison Mode
- Compare two datasets side-by-side (Baseline vs. Comparison).
- Overlay two heatmaps to visualize differences in user behavior.
- Automatically generates a legend indicating which dataset corresponds to which color (red = baseline, green = comparison).
- Supports comparisons by device, user segment, or time range.
5. WooCommerce Integration
- Supports heatmaps for WooCommerce product pages.
- Includes product search functionality for stores with large catalogs.
- Allows filtering by user segment, time range, and device type for product-specific analytics.
- Compare interactions between different products or product variations.
6. Advanced Filters
- Time Range Filter: Analyze interactions over predefined periods or custom date ranges.
- User Segmentation: Filter heatmaps by logged-in users, guest visitors, or custom user groups.
- Device Filter: Separate analytics for desktop, tablet, or mobile users.
7. Export & Reporting
- Excel Export: Download all interaction metrics in a structured spreadsheet for reporting.
- PDF Export: Save heatmap visualizations and behavioral metrics in a professional PDF report.
- Reports include:
- Rage Clicks
- Dead Clicks
- Hover Interest
- Scroll Depth Percentiles
- Weighted Attention Score
- Device Breakdown
8. Enhanced User Experience
- Modern, responsive admin dashboard integrated into WordPress.
- Smooth interaction with loading spinners and status messages.
- Modal notifications replace disruptive alert()
- Heatmaps automatically redraw when filters, dark mode, or device selection changes.
9. Technical Highlights
- Built with JavaScript and jQuery, fully encapsulated to prevent conflicts.
- Uses AJAX for secure, fast, and dynamic data fetching.
- Optimized canvas rendering for performance on long or interactive pages.
- Fully compatible with standard WordPress posts, pages, and WooCommerce products.
Who Can Benefit
- Website Owners & Marketers: Identify which content engages users the most and optimize accordingly.
- UX/UI Designers: Detect friction points and enhance usability.
- E-commerce Businesses: Understand user behavior on product pages to boost conversions.
- Agencies & Developers: Provide clients with detailed heatmap reports demonstrating engagement insights.
Why Choose 3WART Content Performance Heatmap Pro
- Gain complete insight into user behavior on your website.
- Compare datasets for better decision-making.
- Easy-to-use interface with advanced analytics for both beginners and professionals.
- Compatible with WordPress and WooCommerce, making it suitable for all types of websites.
Documentation
Version: 1.0.0
Author: 3WART
1. Overview
The 3WART Content Performance Heatmap Pro plugin allows you to see exactly how visitors interact with your WordPress website. By tracking clicks, mouse movements, scroll behavior, and engagement patterns, this plugin helps you understand which parts of your pages attract attention, which areas frustrate users, and how to improve your website’s usability and conversions.
It works for standard WordPress posts, pages, and WooCommerce product pages.
2. Key Features
- Interactive Heatmaps
- Shows user clicks, mouse movements, and scrolling behavior visually.
- Supports dark mode for better visibility.
- Allows comparing two datasets to analyze differences in behavior.
- Behavioral Insights
- Detect Rage Clicks (users clicking repeatedly in frustration).
- Detect Dead Clicks (clicks on non-interactive elements).
- Detect Hover Interest (areas users hover over without clicking).
- Engagement Metrics
- Total clicks and mouse movements.
- Average scroll depth and scroll depth percentiles (25%, 50%, 75%).
- Weighted Attention Score to summarize user engagement.
- Device breakdown (desktop, tablet, mobile).
- Comparison Mode
- Compare two datasets visually (baseline vs. current).
- Overlay heatmaps to see differences in user behavior.
- Automatically generates a legend showing dataset colors.
- WooCommerce Integration
- Track heatmaps for product pages.
- Search and select products easily for analysis.
- Filter by user segment, device type, or time range.
- Filters
- Time range filter (last day, week, month, or custom range).
- User segment filter (logged-in users, guests, custom groups).
- Device filter (desktop, tablet, mobile).
- Reporting & Export
- Export metrics to Excel.
- Export visual heatmaps and metrics to PDF.
3. Installation
- Download the plugin ZIP file.
- In WordPress admin, go to Plugins → Add New → Upload Plugin.
- Upload the ZIP file and click Install Now.
- Activate the plugin.
- A new menu item “3WART Heatmap” will appear in your WordPress dashboard.
4. Getting Started
After activating the plugin:
- Go to 3WART Heatmap → Dashboard.
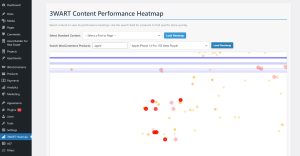
- You will see a heatmap container and controls for selecting content and filters.
4.1 Selecting Content
- Posts & Pages:
- Use the dropdown to select the post or page you want to analyze.
- WooCommerce Products:
- Start typing the product name in the search box.
- Select the product from the results.
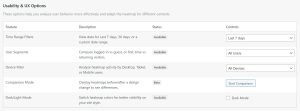
4.2 Applying Filters
- Time Range Filter:
- Predefined ranges like last 7 days, last 30 days.
- For custom dates, select “Custom” and pick start and end dates.
- User Segment Filter:
- Filter data by logged-in users, guests, or custom segments.
- Device Filter:
- Choose Desktop, Tablet, or Mobile to see device-specific behavior.
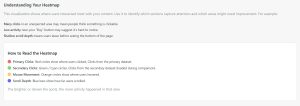
4.3 Viewing the Heatmap
- Click Load Heatmap after selecting content and filters.
- The heatmap will display:
- Red dots: Clicks
- Orange dots: Mouse movement
- Blue bars: Scroll activity
- In dark mode, the colors adjust automatically for better visibility.
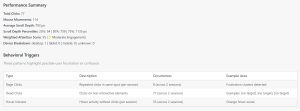
4.4 Behavioral Insights Table
Below the heatmap, you’ll see a table with:
- Rage Clicks: Spots with repeated clicks in a short time.
- Dead Clicks: Clicks on non-clickable elements.
- Hover Interest: Areas with high hover activity without clicks.
- Total Clicks and Mouse Movements
- Average Scroll Depth and Scroll Percentiles
- Weighted Attention Score
- Device Breakdown
4.5 Comparison Mode
- Click Start Comparison to compare two datasets.
- First, load your baseline dataset (A).
- Then, load your comparison dataset (B).
- The heatmap overlays both datasets with different colors:
- Red = Baseline (A)
- Green = Comparison (B)
- A legend below the heatmap explains the colors.
What is Comparison Mode?
Comparison Mode allows you to compare two different sets of user interactions on your website – for example, clicks, mouse movements, and scroll activity. It helps you see how user behavior changes over time, between segments, or across different filters.
With this mode, you can overlay two heatmaps on the same page and easily spot differences. One dataset is shown as red/orange/blue, and the second dataset is shown as green/cyan/greenish so you can distinguish them.
How to Use Comparison Mode
- Enable Comparison Mode
- Click the “Start Comparison”
- The button will change to “Exit Comparison”, indicating that the tool is now in comparison mode.
- At this point, the first dataset you load will be saved as your baseline.
- Load the Baseline Dataset
- Select a post, page, or product from the dropdown menu.
- Apply any filters you want (time range, user segment).
- Click “Load Heatmap”.
- This first dataset will be displayed as the baseline heatmap (red/orange/blue) and saved internally for comparison.
- Load the Comparison Dataset
- Change your filters, select a different post/page/product, or adjust the time range or segment.
- Click “Load Heatmap”
- The second dataset will be overlaid on top of the baseline in green/cyan shades.
- Now, you can visually compare user interactions between the baseline and the new dataset.
- View the Comparison Legend
- A small legend appears below the heatmap.
- Red (A): Baseline dataset
- Green (B): Comparison dataset
- The legend also shows which filters or settings were used for each dataset.
- Exit Comparison Mode
- Click “Exit Comparison” to return to normal heatmap mode.
The overlay disappears, and only a single dataset is shown.
Key Points to Remember
- The first dataset loaded in comparison mode becomes the baseline. You cannot change it unless you restart comparison mode.
- You can compare different filters, such as time ranges or user segments, on the same post/page/product.
- The heatmap colors make it easy to distinguish between baseline and comparison datasets.
- Any dataset loaded before enabling comparison mode is not saved for comparison – only datasets loaded after enabling comparison mode are used.
Step-by-Step Example
- Enable comparison mode → button changes to “Exit Comparison”.
- Load heatmap for Post A (Baseline, red/orange/blue).
- Change filter to last week → load heatmap → overlay appears (green/cyan).
- Compare visually:
- Are users clicking in the same areas?
- Are scroll patterns different?
- Do hover behaviors change?
- Exit comparison mode → back to single dataset view.
4.6 Exporting Data
- Excel Export: Click Export to Excel to download metrics.
- PDF Export: Click Export to PDF to save the heatmap and metrics as a report.
5. WooCommerce Product Heatmaps
- Start typing the product name in the search box.
- Select the product to enable the Load Heatmap
- You can use the same filters as for posts and pages.
- Supports comparison mode for products too.
6. Tips for Effective Use
- Use comparison mode to test changes, like A/B tests or design tweaks.
- Focus on Rage Clicks and Dead Clicks to identify user frustrations.
- Analyze hover interest to understand what draws attention but is not clickable.
- Use device-specific filters to optimize mobile vs desktop experiences.
- Regularly export PDF reports for client presentations or internal reporting.
7. Troubleshooting
- Heatmap does not load:
- Ensure the page has data.
- Check AJAX security nonce is correctly set.
- No products found in WooCommerce search:
- Type at least 3 characters.
- Check that the product is published.
- PDF export fails:
- Ensure umd.min.js is loaded in the WordPress admin.
8. Support & Contact
For questions, bug reports, or feature requests, contact 3WART Support at 3wart.ge@gmail.com or visit https://shop.3wart.ge/.
This documentation covers installation, setup, usage, features, and troubleshooting, making it easy for even non-technical users to start using the plugin effectively.
Related products

3wart Asset Builder For Real Estate Pro
160,00 ₾3WART Content Optimization Assistant & SEO (AI-powered)
Original price was: 53,00 ₾.35,00 ₾Current price is: 35,00 ₾.
AI Site Chat
200,00 ₾
AI WooCommerce Search
160,00 ₾
Variation Gallery Pro for WooCommerce
68,00 ₾
